On this page
- CSAT vs NPS vs CES, side by side
- One set of 20 customers, three CSAT scores and one NPS
- Which to send, and when
- Question templates you can copy
- How many responses before a number means anything
- What counts as a good score
- Split CSAT by who answered
- The honest critique of NPS
- Running them in Talvo
- Frequently asked questions
Twenty customers answer two questions. Seventeen of them rate their last support conversation four or five stars, so your CSAT is 85%. Asked whether they would recommend you to a friend or colleague, the same twenty produce a Net Promoter Score of minus 5.
Both numbers are correct. They describe different things, which is the whole story of CSAT vs NPS. This guide gives you the definitions and formulas side by side, one worked example you can check by hand, a rule for which survey to send and when, 14 question templates you can copy, the sample sizes you need before a number means anything, and the research critique of NPS with its sources. Talvo is the worked example for the setup, and the advice holds for any tool.
CSAT vs NPS vs CES, side by side
| CSAT (customer satisfaction) | NPS (Net Promoter Score) | CES (customer effort score) | |
|---|---|---|---|
| The question | "How satisfied were you with ...?" | "How likely are you to recommend us to a friend or colleague?" | "The company made it easy for me to handle my issue." |
| Scale | Usually 1 to 5 | 0 to 10 | Usually 1 to 7, strongly disagree to strongly agree |
| Formula | Varies: average rating, or percent of 4s and 5s | Percent promoters (9 to 10) minus percent detractors (0 to 6) | Average, or percent who agree |
| What it measures | How one interaction went | How the customer feels about the relationship | How hard the customer had to work |
| Best sent | Right after a conversation is resolved | On a schedule: quarterly, or after onboarding | After a task that could have been painful |
| Range | 1 to 5, or 0 to 100% | -100 to +100 | 1 to 7 |
NPS comes from a December 2003 Harvard Business Review article by Frederick Reichheld, "The One Number You Need to Grow". Its scoring is fixed: promoters are 9 and 10, passives are 7 and 8, detractors are 0 to 6, and the score is the percentage of promoters minus the percentage of detractors (Bain's Net Promoter System). Passives count in the total but not in the score. Net Promoter, NPS and Net Promoter Score are registered trademarks or service marks of Bain & Company, NICE Systems and Fred Reichheld.
CSAT has no such owner, and that matters, as the next section shows.
One set of 20 customers, three CSAT scores and one NPS
These twenty pairs of answers are made up to show the arithmetic. Each customer rated their last support conversation from 1 to 5 stars and answered the recommend question from 0 to 10.
| CSAT rating | Customers |
|---|---|
| 5 stars | 12 |
| 4 stars | 5 |
| 3 stars | 1 |
| 2 stars | 1 |
| 1 star | 1 |
| NPS answer | Customers |
|---|---|
| 10 | 2 |
| 9 | 3 |
| 8 | 5 |
| 7 | 4 |
| 6 | 3 |
| 5 | 1 |
| 3 | 1 |
| 2 | 1 |
Now the scores.
| Score | Working | Result |
|---|---|---|
| CSAT, average rating | (12×5 + 5×4 + 1×3 + 1×2 + 1×1) ÷ 20 = 86 ÷ 20 | 4.30 |
| CSAT, percent satisfied (4 or 5) | (12 + 5) ÷ 20 | 85% |
| CSAT, percent very satisfied (5 only) | 12 ÷ 20 | 60% |
| NPS promoters | 2 + 3 = 5 customers | 25% |
| NPS passives | 5 + 4 = 9 customers | 45% |
| NPS detractors | 3 + 1 + 1 + 1 = 6 customers | 30% |
| NPS | 25% promoters minus 30% detractors | -5 |
Three observations.
First, the same raw ratings give you 4.30, 85% or 60%, depending on the convention. CSAT has no standard formula. Many tools report the percentage of 4s and 5s; some report the average; some count only the top box. A 4.3 from one tool and an 85% from another are the same data. Never compare scores across tools without checking the formula.
Second, the customers who scored you well on the conversation are not the ones willing to recommend you. Of the 17 who were satisfied, at most 5 can be promoters, because only 5 customers answered 9 or 10. A conversation can be handled perfectly and the customer can still feel the product is too expensive or too hard to use.
Third, this is not a defect in either measure. CSAT tells you whether your support team did its job. NPS tells you something about the whole relationship, only some of which support controls.
Which to send, and when
The decision rule is short. Send CSAT right after a conversation ends, because it asks about that conversation and fades from memory fast. Send NPS on a schedule, never after every chat, because it asks about everything and a bad afternoon in support shouldn't swing a relationship score.
- Tied to a specific conversation, so a low score points at a specific thread
- Quick to answer, so response rates are healthier than long surveys
- Reads as a fair measure of the support team's work
- Says little about whether the customer will renew or recommend you
- No standard formula, so scores from different tools don't compare
- Biased toward people with something strong to say
- One fixed question and fixed scoring, so you can trend it against yourself for years
- The follow-up comment often tells you more than the number
- Has public benchmarks, if you take them with care
- Measures the whole relationship, not support; it is slow to move
- The research case that it predicts growth is contested (see below)
- On a small base, one customer swings it by several points
If you send both, keep them apart in time. A customer who rated their chat five stars on Tuesday shouldn't be asked the recommend question on Wednesday. A sensible small-team rhythm, once you have cut the repeat questions and are hitting your first response time targets, is a CSAT prompt on every resolved conversation, an NPS survey once a quarter to customers who have been with you more than a month, and a short CES question after anything that tends to be painful, such as a refund or a data import.
Question templates you can copy
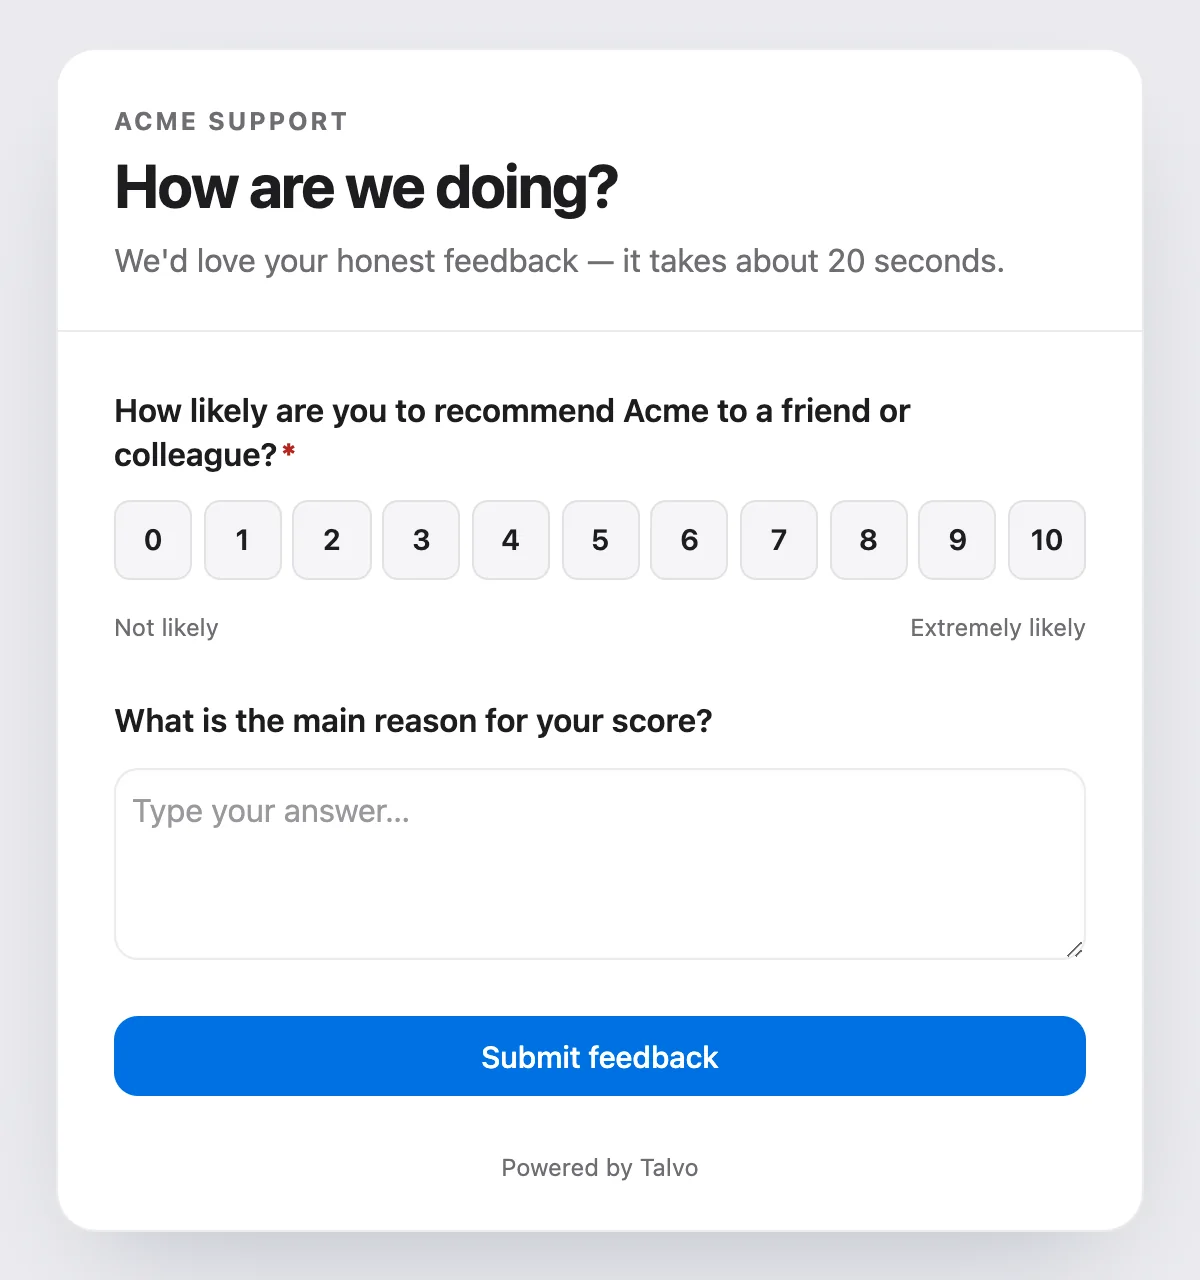
Fourteen templates, grouped by what they measure. Keep each survey to one scored question plus one optional comment. In our view, a third question is where response quality tends to fall; SurveyMonkey's guidance also warns about survey length.
CSAT templates
| # | Use | Send | Question | Answer format |
|---|---|---|---|---|
| 1 | After a chat | When the chat is resolved | "How satisfied were you with the help you got today?" | 1 to 5 stars, optional comment |
| 2 | After an email thread | When the thread is resolved | "How would you rate the support you received on your question about [topic]?" | 1 to 5 stars, optional comment |
| 3 | After an AI answer | When the AI resolves it | "Did this answer solve your problem?" | Yes, partly or no (one question; skip the 1 to 5 rating) |
| 4 | Onboarding | After setup is finished | "How satisfied are you with getting set up so far?" | 1 to 5 stars, optional comment |
| 5 | Billing question | After a billing or refund issue is resolved | "How satisfied were you with how we handled your billing question?" | 1 to 5 stars, optional comment |
NPS templates
| # | Use | Send | Question | Answer format |
|---|---|---|---|---|
| 6 | Relationship | Quarterly, to customers of 30+ days | "How likely are you to recommend [Company] to a friend or colleague?" | 0 to 10 |
| 7 | After onboarding or first purchase | About 30 days in | The same standard question | 0 to 10 |
| 8 | B2B account | Twice a year, to the main contact and a user | "How likely are you to recommend [Company] to a colleague at another company?" | 0 to 10 |
| 9 | Follow-up by score band | Immediately after the score | 9 to 10: "What do you value most?" 7 to 8: "What would make it a 9 or 10?" 0 to 6: "What went wrong, and what should we fix first?" | Free text |
Open-ended and effort templates
| # | Use | Send | Question | Answer format |
|---|---|---|---|---|
| 10 | Any score | With every scored question | "What is the main reason for your score?" | Free text |
| 11 | Improvement | After a CSAT of 3 or lower | "What is one thing we could have done better?" | Free text |
| 12 | Onboarding friction | At the end of setup | "What almost stopped you from finishing setup?" | Free text |
| 13 | Effort | After a refund, import or account change | "The company made it easy for me to handle my issue." | 1 to 7, strongly disagree to strongly agree |
| 14 | Effort follow-up | After a low effort score | "What was the hardest part of getting this resolved?" | Free text |
Neutral wording matters more than clever wording. "How great was our support?" pushes people toward a high answer. "How satisfied were you" doesn't. Keep the scale direction the same every time, label the ends, and don't change the scale partway through a trend line.
How many responses before a number means anything
A percentage from twenty answers is closer to an anecdote than a measurement. For a score like 85% satisfied, the rough 95% margin of error is about plus or minus 16 points at 20 responses, 10 points at 50, 7 points at 100 and 3.5 points at 400. NPS is noisier because it combines two percentages: for the split in our example, the margin is roughly plus or minus 32 points at 20 responses, 21 at 50, 14.5 at 100 and 7 at 400.
| Responses | CSAT margin (at 85% satisfied) | NPS margin (25% promoters, 30% detractors) |
|---|---|---|
| 20 | ±16 points | ±32 points |
| 50 | ±10 points | ±21 points |
| 100 | ±7 points | ±14.5 points |
| 400 | ±3.5 points | ±7 points |
These come from the standard normal approximation, which is rough at small counts, and they assume the people who answered are a fair sample of everyone. They usually aren't. People with a strong opinion answer more often. So treat the margins as the best case.
What this means in practice: a small team sending NPS to 60 customers a quarter should expect the score to jump around by 10 or more points for no reason. Look at the comments, the trend across several quarters, and the distribution. Don't celebrate a four-point gain or panic over a six-point drop.
- One scored question plus one optional comment
- Neutral wording, no "how great" phrasing
- Same scale direction and labels every time
- CSAT only after the conversation is truly resolved, not on a conversation you closed to clear the queue
- NPS on a schedule, not after every chat
- The sample is large enough to read, and you report the response count next to every score
- You compare to your own past results first, and only loosely to anyone else's
- Someone reads the free-text comments every week
What counts as a good score
Honestly: your own trend beats any benchmark. Still, these are the sourced numbers, each with its limit.
| Source | Figure | What it is, and what it isn't |
|---|---|---|
| ACSI, Q1 2026 | National score 76.7 out of 100 | A modeled national index, not a CSAT percentage; use for context only |
| Survicate NPS benchmarks, 2025 | Median NPS 42 across all industries; software 30 (B2B 29, B2C 47) | 599 companies, 5.4 million responses; vendor data from its own customers |
| HubSpot State of Customer Service | CSAT and retention tied as the top CX metrics at 31% each, then response time at 29% | A survey of service leaders on what they track; not a score |
| Zendesk 2015 benchmark | Live chat at 92% satisfaction, the highest channel | Eleven years old and from Zendesk's customers; history, not a target |
You will often read that a CSAT above some percentage in the 70s or 80s is "good". We looked for a primary source for that rule and didn't find one, so we don't repeat it. A software company with a median NPS of 30 and a CSAT of 4.3 stars isn't failing; a company with a CSAT that fell by half a star in a quarter has a problem worth finding.
Split CSAT by who answered
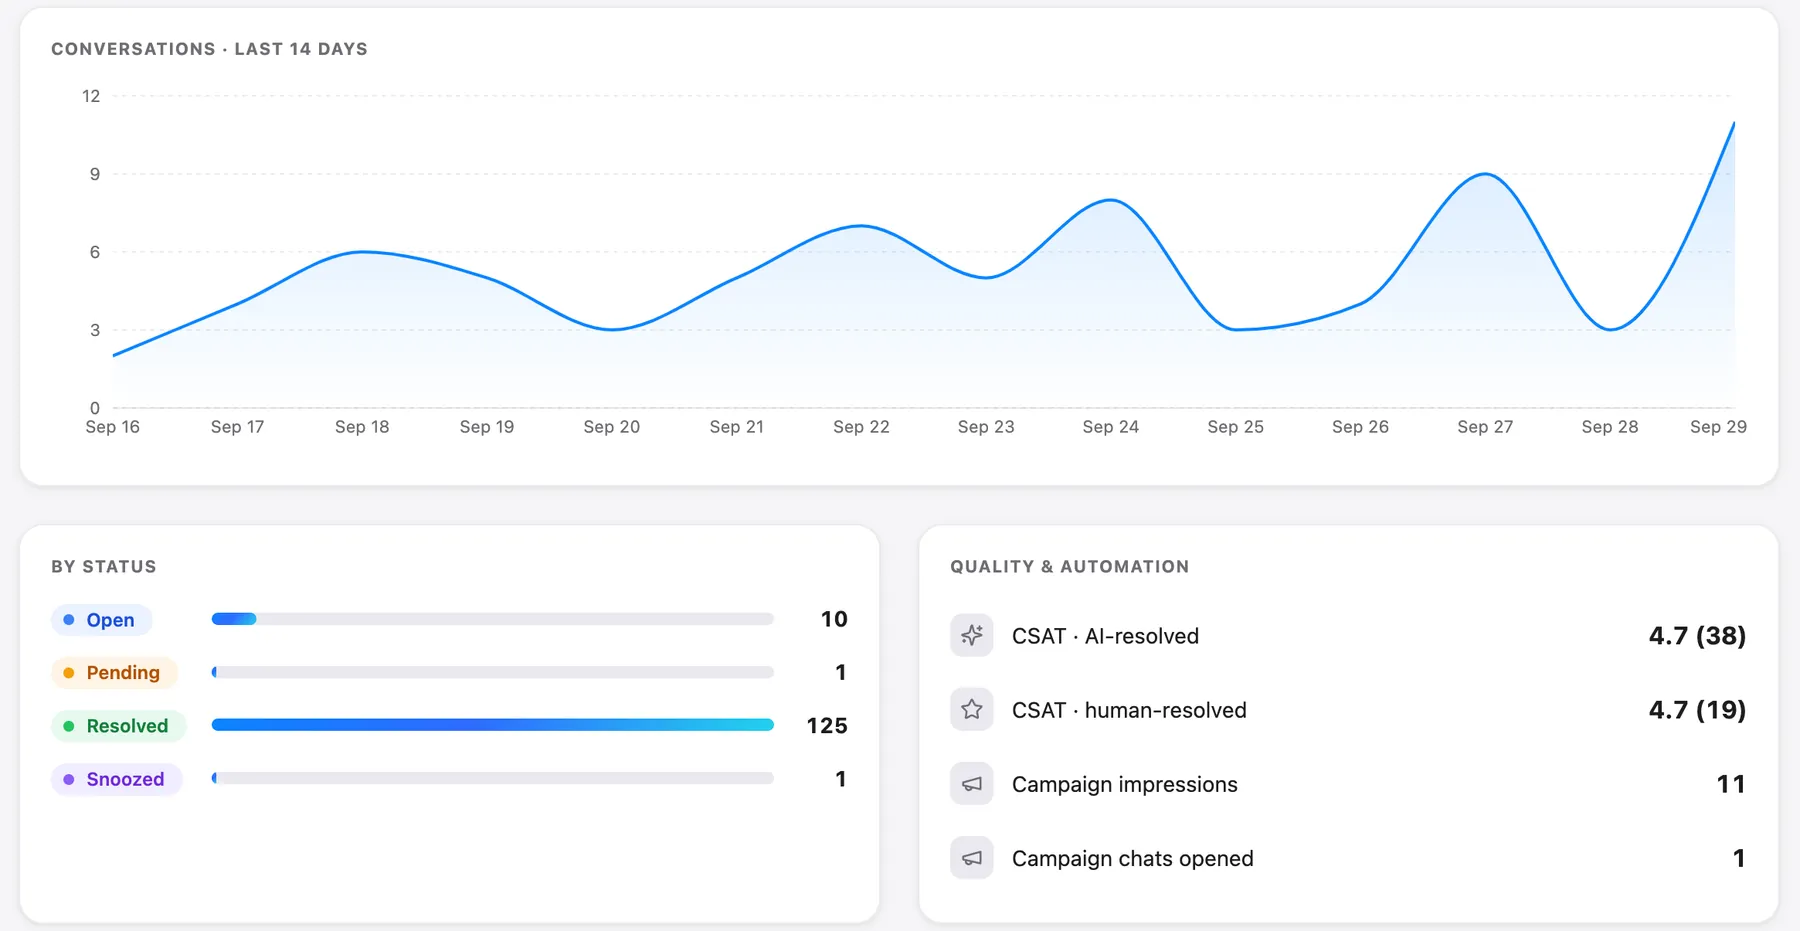
If you run an AI agent, the most useful cut of your satisfaction data is AI-resolved conversations against human-resolved ones. An AI that closes more conversations while lowering satisfaction on the ones it closes is moving work around, not helping. A billed resolution is not proof that the customer was happy: see AI resolution pricing for what vendors count as a resolution, and AI resolution rate for how to measure the share your AI really closes.
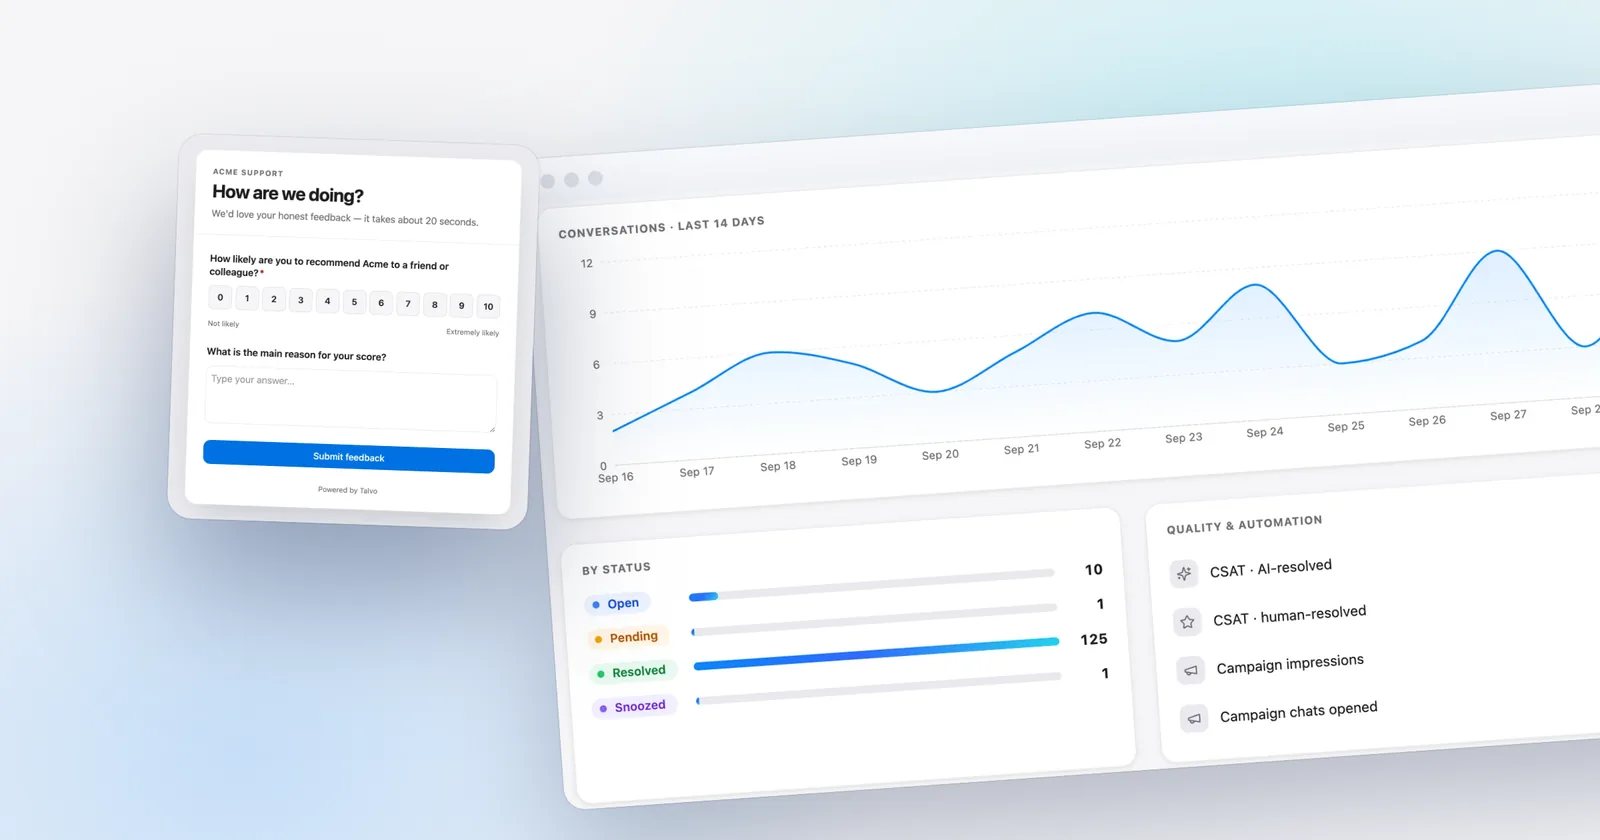
This is the number to check before you turn automation up. The measurement side of that is covered in the knowledge base chatbot guide. In Talvo, the CSAT on a conversation shows whether the AI or a person handled it, CSAT averages appear in Analytics next to volume and response times, split between AI-resolved and human-resolved conversations, and the AI performance dashboard on the Scale plan ($299 a month) charts that split alongside the hand-off funnel.
The honest critique of NPS
NPS became popular on a strong claim: that this one question predicts a company's growth better than other measures. Reichheld's 2003 article is where that began. The follow-up research is less kind.
Keiningham, Cooil, Andreassen and Aksoy examined 21 firms using more than 15,500 interviews from the Norwegian Customer Satisfaction Barometer. Their 2007 paper in the Journal of Marketing, "A Longitudinal Examination of Net Promoter and Firm Revenue Growth", failed to replicate the claim that NPS was clearly superior to other measures such as the ACSI. It won the 2007 MSI/H. Paul Root Award (record). Separately, a MeasuringU re-examination found that Reichheld's original data correlated NPS with past growth rather than future growth.
In May 2021, Gartner predicted that by 2025 more than 75% of organizations would have abandoned NPS as a measure of success for customer service and support (Gartner). That didn't happen, at least not among survey-tool customers: Survicate reported that 67.7% of its paying customers still ran NPS surveys in 2025 (Survicate). That is vendor data, but it shows the habit outlasted the forecast.
So what do you take from this? Use NPS for what it reliably does, which is give you one consistent question to trend and a prompt for comments. Don't use it as proof that you'll grow, and don't set a support team's bonus on it. For judging support, CSAT, the AI-versus-human split and the comments tell you more.
Running them in Talvo
Talvo has two surveys. The first is automatic: when a conversation is marked resolved, the customer sees a short star-rating prompt in the messenger with an optional comment. It appears once per conversation, and the rating lands on the thread, so you can see the score beside the conversation that earned it. The second is standalone surveys you build in Settings → Automation, with question types for NPS, rating, choice and text. Each gets its own public page you can link from an email, a chat or your site. The post-resolution star rating is on every plan, including Free. Standalone NPS, rating, choice and text surveys are included from the Starter plan ($49 a month, or $39 billed annually).
- Resolve conversations only when finishedThe rating prompt appears automatically once per resolved conversation, with an optional comment, so closing a thread to clear the queue produces a rating request for it. See CSAT and NPS.
- Build an NPS surveyIn Settings → Automation, add an NPS question and the matching follow-up from template 9, then share the page link in an email or on your site.
- Map the other templatesUse rating for CSAT-style questions, choice for the yes/partly/no questions, and text for the open-ended ones.
- Read the resultsResponses are listed individually, so a number you don't like leads back to the specific answers behind it.
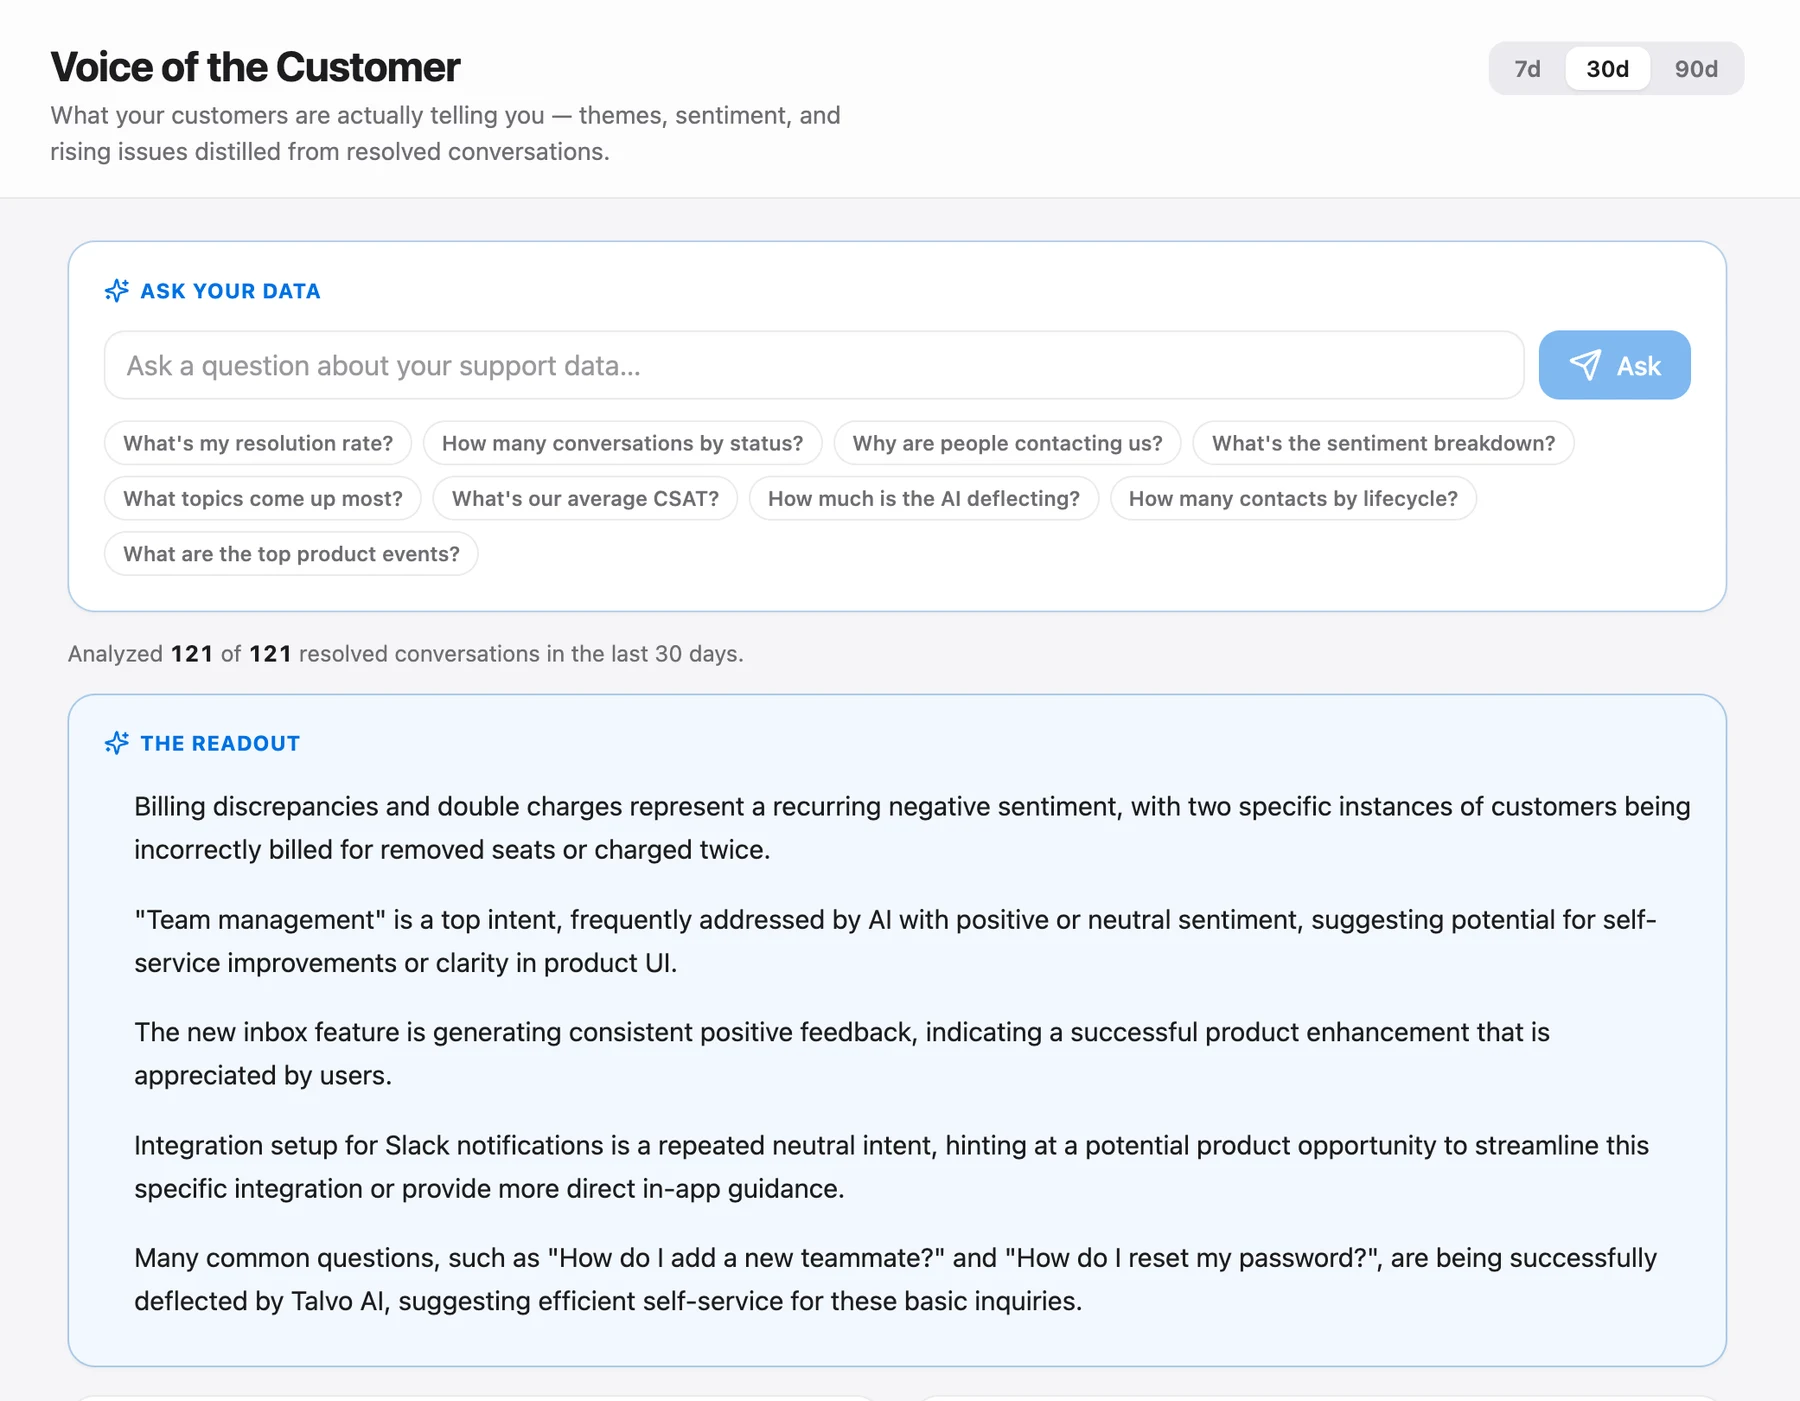
- Pair scores with themesCompare satisfaction with what customers are asking about; on the Scale plan, the Voice-of-Customer digest groups resolved conversations by theme and sentiment.
Where Talvo falls short: the help doesn't describe a built-in customer effort score, so template 13 would use a rating question on a standalone survey. The star-rating prompt shows an average rather than a percentage satisfied, and the help doesn't document triggering a standalone survey automatically at a point in the customer journey, so you send the link yourself. And Talvo is new and in beta: it has no customer benchmark data of its own, and none appears in this guide.
Frequently asked questions
What is the difference between CSAT and NPS?
CSAT asks how satisfied a customer was with a specific interaction, usually on a 1 to 5 scale, right after it happens. NPS asks how likely they are to recommend you on a 0 to 10 scale and measures the relationship as a whole. CSAT tells you how support performed; NPS reflects everything about the company.
How do you calculate CSAT?
There is no single standard. Many tools report the percentage of customers who rate 4 or 5 out of 5, while others report the average rating. With 12 five-star, 5 four-star, 1 three-star, 1 two-star and 1 one-star ratings, the percentage satisfied is 85% and the average is 4.30. Talvo reports the average star rating.
How is NPS calculated?
Ask how likely customers are to recommend you on a 0 to 10 scale. Promoters answer 9 or 10, passives 7 or 8, and detractors 0 to 6. NPS is the percentage of promoters minus the percentage of detractors, giving a score from -100 to +100.
What is a good CSAT score?
There's no reliable universal answer, because CSAT is calculated differently across tools and we found no primary source for the often-quoted thresholds. Compare yourself to your own trend and to the AI-versus-human split. The ACSI national score, 76.7 out of 100 in Q1 2026, is context rather than a target.
What is a good NPS score?
Survicate's 2025 benchmarks, drawn from 599 companies and 5.4 million responses, give a median NPS of 42 across industries and 30 for software (29 for B2B, 47 for B2C). That is vendor data from its own customers. With fewer than a hundred responses, the margin of error is wide, so watch your trend.
When should you send a CSAT survey vs an NPS survey?
Send CSAT immediately after a conversation is resolved, while the experience is fresh. Send NPS on a schedule, such as quarterly or about 30 days after onboarding, and never after every chat. Keep them apart in time so the same customer is not asked twice in a day.
What is CES and how is it different?
CES, the customer effort score, asks how easy it was to get something done, usually by asking customers to agree or disagree with a statement such as the company made it easy to handle my issue. It measures friction rather than satisfaction or loyalty and works best after painful tasks. Talvo's help does not describe a built-in effort score.
Does Talvo support CSAT and NPS?
Yes. The star-rating prompt after a resolved conversation is on every plan, with an optional comment, and standalone surveys (NPS, rating, choice, text, each with a public page) start on the Starter plan. Talvo scores NPS the standard way and reports CSAT as an average star rating.
Sources
Other products' prices and features change. We checked these pages; if something is out of date, tell us and we'll fix it.
- Bain: measuring your Net Promoter Score
- Reichheld, The One Number You Need to Grow (HBR, Dec 2003)
- Keiningham et al., A Longitudinal Examination of Net Promoter and Firm Revenue Growth (2007)
- MeasuringU: NPS replication
- Gartner: more than 75% of organizations will have abandoned NPS (May 2021)
- Survicate NPS benchmarks 2025
- Survicate: NPS rebellion
- ACSI Q1 2026 results (Business Wire)
- HubSpot customer service statistics
- Zendesk 2015 benchmark: live chat satisfaction
- Talvo: measure satisfaction with CSAT and NPS