
Volume, first-response time, CSAT, channel mix and dollars deflected — real numbers that tell the story of your support org at a glance.
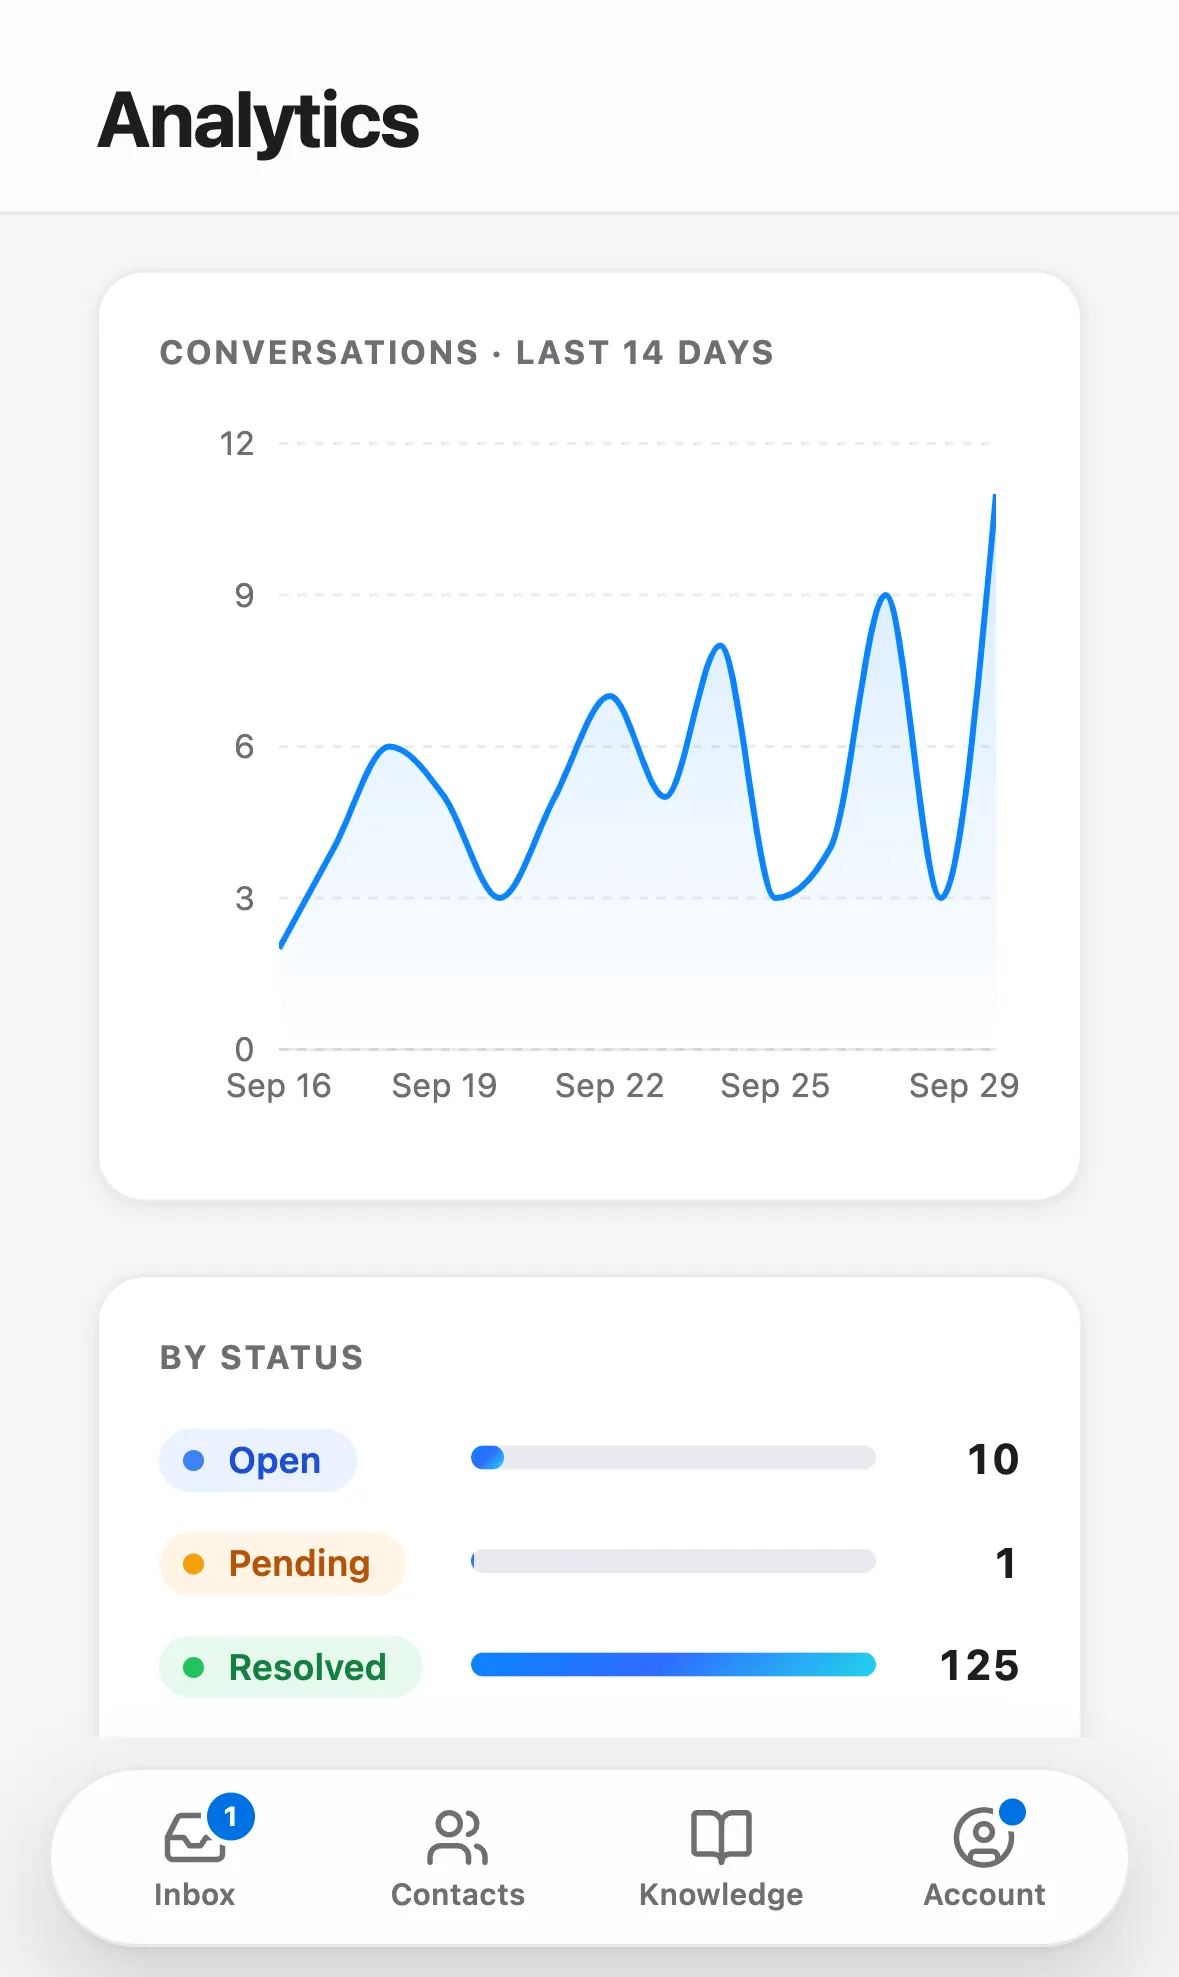
The real Talvo app, shown with our demo workspace.
The story of your support, at a glance
From response times to the dollars your AI deflects — the numbers that make the impact obvious.
Response and resolution times
Median first-response time, resolution time and volume by channel — trended over time and compared to the previous period, so you know instantly whether you're getting faster.
- First-response & resolution trends
- Volume by channel
- Compared to the prior period
CSAT and the AI-vs-human split
See satisfaction on every reply, broken down by whether the AI or a human handled it — and how much the AI is deflecting so your team can focus on the hard problems.
- CSAT on AI and human replies
- Deflection rate over time
- Spot where quality dips
Dollars deflected, in the open
Every AI resolution is valued against what a human ticket would cost — so the return on automation is a number on the dashboard, not a guess.
- Dollars deflected by automation
- Cost per resolution
- ROI you can show your boss
Ask in plain English — and see what to fix
Type a question like “why are people contacting us?” and Talvo runs the right query over your data. An AI performance dashboard shows the engage → resolve → hand-off funnel and how grounded the answers were, and surfaces the exact topics your AI keeps handing off — the gaps to close next.
- Ask your data in natural language — no SQL
- Engage → resolve → hand-off funnel & grounding rate
- The hand-off topics that are your KB gaps
Which plans include it
- Free$0included
- Starterfrom $39/moincluded
- Growthfrom $119/moincluded
- Scalefrom $249/moincluded
History: 7 days on Free, 90 days on Starter, 1 year on Growth and unlimited on Scale. The AI performance dashboard is on Scale.
Compare every planQuestions, answered
Let the agent take the first shift.
Three steps, and the agent is answering.
- Add the messengerOne script tag, just before
</body>.Install the chat widget - Import your help centerCrawl your own site, or bring your articles over from your old help desk.Import by crawling your site
- Invite your teamOne flat price for the workspace, up to your plan's teammate cap.Invite your team
<!-- Settings → Chat widget → copy your snippet -->
<script async src="https://talvo.chat/_api/widget/loader?app=your-app-id"></script>
</body>